Tool
Hermes Agent Dashboard and Web UI: Self-Hosted AI Agent Command Center
Use the Hermes Agent dashboard/Web UI as a private self-hosted AI agent command center: profiles, sessions, analytics, logs, memory, skills, MCP, cron jobs, provider state, gateway health, and browser Chat. Updated with current GSC dashboard demand, July 2026 community evidence, and the exact FlyHermes boundary for hosted browser/mobile access.
Quick answer
The Hermes Agent dashboard is the self-hosted command center for a Hermes runtime: open it with `hermes dashboard`, use the default local port 9119, inspect profiles, sessions, analytics, logs, cron jobs, skills, MCP, models, gateway health, and browser Chat, then verify real Telegram/Discord/cron delivery outside the UI. Keep it private behind localhost, SSH tunnel, VPN, or authenticated HTTPS. If the goal is hosted browser/mobile chat, managed channel uptime, and less VPS/provider maintenance, choose FlyHermes instead of exposing a self-hosted admin panel.
The latest GSC snapshot still makes `/tools/hermes-web-ui` the canonical page for dashboard intent: `hermes dashboard` has 7,448 impressions at avg position 6.49, `hermes agent dashboard` has 4,456 impressions at avg position 4.98, `hermes web dashboard` has 957 impressions at avg position 3.48, and `hermes agent ui` is stuck near avg position 9.0. The 2026-07-06 refresh also adds fresh YouTube evidence: dashboard walkthroughs now frame Web UI as the place to inspect sessions, logs, cron jobs, analytics, config, and gateway state when terminal-only agent operation becomes hard to trust.
Hermes Agent Web UI Dashboard – All Features Explained — BoxminingAI
Ron from BoxminingAI walks through the Hermes Agent web dashboard feature-by-feature. He shows how to launch it with `hermes dashboard`, access it via SSH tunnel from a VPS on port 9119, and use every major section: Sessions (including system cron messages), Analytics (token usage and per-model breakdown), Logs (for debugging failed cron jobs), Cron Jobs (create schedules with delivery to Discord/Telegram/email), Skills (browse all installed skills by category), and Config (fallback providers, gateway timeout, smart routing, memory, display, and auxiliary sub-agent settings).
- 0:00Introduction – live web dashboard overview
- 0:47Launching: `hermes dashboard` and port 9119
- 1:10VPS access via SSH tunnel (not direct link)
- 2:30Sessions tab – chat and system cron messages
- 4:10Analytics – API calls, token usage, per-model breakdown
- 5:00Logs – debug failed cron jobs
- 5:50Cron Jobs – create schedules and delivery targets
- 7:40Skills – browse installed skills by category
- 9:10Config – fallback providers, timeout, memory, routing, auxiliary

Setup steps
- 1Update Hermes Agent, then run hermes doctor before opening the dashboard.
- 2Start the dashboard locally with hermes dashboard or choose a port with hermes dashboard --port 9120 --no-open.
- 3If you enable browser Chat/`--tui`, treat it as local TUI access through WebUI, not as FlyHermes managed cloud chat.
- 4Use `hermes dashboard --no-open` on a server and open it only through a trusted SSH tunnel, VPN, or authenticated reverse proxy; use `--port 9120` if 9119 is occupied.
- 5Use the dashboard as an operator checklist: profile, provider, memory, skills, tools, cron, logs, gateway, and browser Chat status before you trust a long-running agent.
- 6Use the dashboard for configuration/status checks: memory, skills, tools, cron jobs, profiles, model/provider settings, and gateway health.
- 7In the dashboard, check the exact active profile and Hermes home path before editing .env, config.yaml, tools, or gateway settings. Many “dashboard broken” issues are really wrong-profile issues.
- 8Keep the self-hosted dashboard private. Do not expose it raw to the public internet; use localhost, SSH tunnel, VPN, or strong reverse-proxy controls.
- 9For Telegram/Discord production bots, pair the dashboard with hermes gateway status, logs, and a real end-to-end message test so a green UI is backed by delivery proof.
- 10Choose FlyHermes when the desired outcome is hosted browser chat, mobile access, connected channels, API costs bundled, and managed uptime instead of maintaining a VPS, Docker stack, and gateway restarts.
- 11Use the dashboard as the buying checkpoint: if a teammate needs browser visibility plus Telegram/Discord uptime but nobody wants to own HTTPS, auth, provider keys, VPS restarts, and gateway logs, route them to FlyHermes.
- 12For Hermes Desktop remote-backend setups, open the backend WebUI after connection and verify that the Desktop client is pointing at the intended profile, provider, model, and gateway state.
- 13If the dashboard loops or reloads in local/loopback mode, update Hermes to the latest v0.15 patch before changing dashboard auth or reverse-proxy settings.
- 14Use the dashboard Chat tab only inside the same trusted boundary as the rest of WebUI. Install the web/pty extras if Hermes reports missing dependencies. Treat this as local TUI-in-browser, not hosted cloud chat.
- 15If `hermes dashboard` says npm is unavailable even though Node/npm exist, build the web frontend once from the Hermes source checkout or set `HERMES_WEB_DIST` to the built `hermes_cli/web_dist` directory before relaunching.
- 16For the exact search query “how to open Hermes dashboard”: run `hermes doctor`, then `hermes dashboard`; if the browser does not open, visit the localhost URL printed by the command.
- 17For “Hermes dashboard port”: the default is 9119; use `hermes dashboard --port 9120` or another free port when 9119 is occupied.
- 18For “Hermes dashboard on server”: run `hermes dashboard --no-open` and reach it through SSH tunnel, VPN, or authenticated HTTPS rather than exposing a raw public port.
Command map
hermes doctor && hermes dashboardUse this local-first path after installation: verify provider/config health, then open the dashboard on the default localhost port.
If `hermes doctor` fails, fix provider keys, PATH, or config before treating Web UI as broken.
hermes dashboard --no-open --port 9120Start the dashboard on a predictable private port for SSH/VPN access when the default 9119 port is occupied or a browser cannot open automatically.
Do not bind the dashboard to a public interface unless you have hardened authentication and network access controls.
hermes dashboard --port 9120Use this when port 9119 is occupied or when a teammate needs a predictable non-default local port.
Changing the port does not make it safe to expose publicly; it is still an admin surface.
hermes dashboard --no-openUse this on VPS, SSH, launchd, cron-like, or headless server environments where opening a local browser is wrong.
Pair it with SSH tunneling, VPN, or authenticated HTTPS rather than clicking a server-side localhost URL.
ssh -L 9119:localhost:9119 user@your-vpsUse this to view a private VPS dashboard from your laptop while keeping the dashboard bound to the server's localhost.
Do not open the raw dashboard port to the internet just to avoid tunneling.
HERMES_WEB_DIST=$HOME/.hermes/hermes-agent/hermes_cli/web_dist hermes dashboard --no-openUse this recovery path when built dashboard assets exist but a reduced macOS/launchd PATH makes Hermes think npm or web_dist is missing.
This is a dashboard launch fix; it does not repair provider credits, gateway routing, or Telegram/Discord permissions.
hermes gateway status && hermes sessions listUse these after a dashboard check to prove the runtime is alive and recent sessions/gateway state match the profile shown in Web UI.
For Telegram or Discord, the final proof is still one real message in the exact chat, topic, or thread.
hermes dashboard --isolatedRun a dedicated per-profile dashboard server instead of routing through the unified machine dashboard.
Use this only when separate dashboard auth/exposure boundaries are intentional.
cd ~/.hermes/hermes-agent && uv pip install -e ".[web,pty]"Install the optional web dashboard and PTY dependencies when a source checkout lacks the HTTP stack or browser Chat support.
Keep the dashboard private; installing extras does not make public exposure safe.
Self-hosted Web UI or FlyHermes?
Choose self-hosted Web UI
You want to run Hermes yourself, inspect local configuration, debug providers/gateways/cron, and keep the admin surface private behind localhost, SSH tunnel, VPN, or authenticated HTTPS.
Avoid when: Your team mainly wants phone/browser chat, always-on channels, bundled provider costs, and no server maintenance.
Choose FlyHermes
You want the Hermes outcome without owning VPS uptime, Docker, reverse proxies, provider keys, gateway restarts, and dashboard access control.
Avoid when: You specifically need to own the runtime and are comfortable operating the server/security layer yourself.
Use both during migration
Keep the self-hosted dashboard as a diagnostic/reference surface while moving production browser/mobile/channel workflows to FlyHermes.
Avoid when: You are trying to expose the self-hosted dashboard as a public app without hard auth, HTTPS, firewalling, and operational monitoring.
Stop debugging in the dashboard
Use CLI/log checks when the dashboard is green but a real Telegram/Discord message, cron delivery, or provider call still fails.
Avoid when: The issue is a pure visibility question such as which profile, model, tools, skills, sessions, or cron jobs are active.
Use Web UI as the command center
You own the Hermes runtime and need to inspect profiles, sessions, analytics, logs, cron jobs, skills, MCP, config, gateway health, and browser Chat inside a private operational boundary.
Avoid when: You need a public/team browser workspace, mobile access, managed uptime, bundled setup help, or channel operations without maintaining the host.
What you can verify
Features
- ✓Configuration dashboard for the active Hermes profile
- ✓Status view for model, provider, tools, memory, skills, cron jobs, profiles, and gateway health
- ✓Gateway monitoring for Telegram, Discord, Slack, webhooks, and background services
- ✓Local-first admin surface that should stay private behind localhost, VPN, SSH tunnel, or trusted reverse proxy access
- ✓Clear product boundary: self-hosted Web UI for operations; FlyHermes for hosted browser/mobile chat, channels, and managed uptime
- ✓Profile/path verification before debugging Telegram, Discord, cron, or provider failures
- ✓Operational checklist for safe local, VPS, Docker, and reverse-proxy usage
- ✓Local launch command: hermes dashboard, with --port and --no-open for VPS/server workflows
- ✓Troubleshooting boundary: dashboard status is useful, but a real Telegram/Discord message is the final proof
- ✓Remote backend verification for Hermes Desktop setups
- ✓Dashboard 401 loopback reload fix awareness
- ✓Embedded browser Chat tab backed by the real Hermes TUI when web and PTY dependencies are installed
- ✓Default localhost port 9119 with --host, --port, --no-open, and --insecure boundary awareness
- ✓Current docs boundary: localhost dashboard stays local by default; non-local exposure needs authentication, firewalling, and strong operational discipline
- ✓v0.16 Surface Release coverage: native desktop, expanded Web UI admin panel, remote backend workflows, and updated self-hosted vs FlyHermes boundary
- ✓Plain-language boundary: self-hosted dashboard/WebUI is for configuration and monitoring; FlyHermes is the hosted browser/mobile agent workspace with managed uptime.
- ✓Answers new GSC long-tail dashboard questions: how to open Hermes dashboard, dashboard command, dashboard port, --no-open, --tui/browser Chat, login/auth, and whether Hermes has a Web UI.
- ✓Use the dashboard as a diagnostic checkpoint for cron, Telegram, Discord, Docker, and provider issues, but require a real channel message or delivered cron result before calling the system healthy.
- ✓Exact command coverage for GSC long-tail searches: `hermes dashboard`, default port 9119, `--port`, `--no-open`, `--host`, `--insecure`, and private access boundaries
- ✓Reader-first command map: `hermes dashboard`, default port 9119, `--port`, `--no-open`, private tunnels, and browser Chat boundaries
- ✓Decision path for searchers: local dashboard for self-hosted operations, FlyHermes for hosted browser/mobile chat and managed uptime
- ✓Weekly buyer-demand upgrade: GSC dashboard queries, YouTube dashboard videos, Reddit monitor threads, and Discord support clusters all point to dashboard/control-plane intent rather than generic UI curiosity
- ✓Pricing decision support: shows when the dashboard is enough for self-hosted operators and when FlyHermes is the better managed path
- ✓2026-06-29 rank-up refresh: maps high-impression GSC dashboard queries directly to command, port, VPS, Chat tab, analytics, logs, cron, sessions, and FlyHermes decision answers
- ✓Current evidence boundary: fresh GSC/YouTube/Reddit drive this upgrade; Discord dashboard examples are treated as stale historical support-demand evidence until the CDP refresh is repaired
- ✓Machine-level dashboard behavior: one local server can manage every Hermes profile on the machine through the profile switcher.
- ✓Profile switcher clarity: Config, API Keys, Skills, MCP, Models, and Chat follow the selected profile while gateway processes remain separately managed.
- ✓`--isolated` mode for operators who intentionally need a dedicated per-profile dashboard server instead of the unified machine dashboard.
- ✓Current prerequisite boundary: the web dashboard needs the optional web extra; browser Chat also needs PTY support so the TUI can run behind a pseudo-terminal.
- ✓Fresh public docs evidence confirms `--insecure` is dangerous because non-local binding can expose API keys and operational controls without a trusted boundary.
- ✓Use the dashboard MCP catalog and tool-selection views as a safety checkpoint before exposing new MCP tools to gateways or cron jobs.
- ✓2026-07-06 command-center positioning for AI agent dashboard searches: sessions, analytics, logs, cron jobs, skills, MCP, config, gateway health, and browser Chat in one private operations surface
- ✓Fresh source boundary: GSC dashboard queries, YouTube dashboard walkthroughs, Reddit/Claude Code monitor pain, and stale-but-useful Discord support clusters all support upgrading this canonical page rather than publishing a duplicate dashboard article
Why this tool matters
Searchers looking for hermes web ui, hermes webui, hermes dashboard, or hermes agent dashboard usually want the same thing: a browser surface that explains what Hermes is doing without forcing them to live in terminal logs. The released self-hosted dashboard is that operations surface: it helps you inspect configuration and state, not outsource hosting and operations.
Use it to inspect the active profile, enabled tools, memory state, skills, cron jobs, model/provider configuration, sessions, and gateway health. It is especially useful when a Telegram or Discord bot appears configured but the long-running service, working directory, provider credentials, topic routing, or allowlist is wrong.
Do not treat Web UI as a hosted product by itself. Current Hermes docs include a browser Chat tab in the dashboard when the web and PTY dependencies are installed; it is still a self-hosted PTY-backed TUI running on your machine/server, not managed cloud uptime or a public mobile workspace.
A good dashboard check is specific: confirm the profile name, model/provider, memory provider, enabled toolsets, cron schedule, gateway service state, and the exact Telegram/Discord target. Then verify the same workflow outside the dashboard with hermes doctor, hermes gateway status, logs, and one real end-to-end message. A green UI without an actual message delivery test is not enough for production.
Run the dashboard only after the CLI works. A practical smoke test is: hermes doctor, hermes chat -q "reply ok", hermes dashboard, then a real Telegram or Discord message if the gateway is involved. This avoids mistaking a pretty admin surface for end-to-end agent health.
For teams, the dashboard should sit behind localhost, SSH tunnel, VPN, or authenticated HTTPS. If the requirement is public browser/mobile chat with connected channels and managed uptime, route the user to FlyHermes rather than exposing a self-hosted admin panel.
June 2026 Desktop and dashboard work clarified an important boundary: Hermes Desktop can point at a remote backend, while the self-hosted Web UI remains the operations dashboard for that backend. Use WebUI to verify the active profile, provider, tools, memory, skills, cron jobs, and gateway state after connecting Desktop to a remote runtime.
If the dashboard appears to reload or throw auth-related errors in loopback mode, update Hermes before changing auth settings. Current docs describe localhost mode as local by default; for non-local deployments, use the built-in authentication path plus normal HTTPS/firewall controls instead of relying on secrecy of the URL.
The current dashboard command defaults to localhost port 9119. Use --port for conflicts, --no-open on servers, --host only when you understand the network exposure, and avoid --insecure unless you have a separate trusted boundary because dashboard access can reveal and change operational state.
Use the Chat tab as a local browser view into the Hermes TUI when web and PTY dependencies are available. It supports the same terminal-style workflow, but Telegram/Discord bots still need platform permissions, allowlists, provider credits, logs, and a real message test.
June 2026 v0.16 made this page more important because the web dashboard is now part of a wider surface story: desktop app, dashboard/admin panel, remote backend, channels, credentials, webhooks, memory, and authentication. The copy keeps those improvements separate from FlyHermes so searchers understand what is self-hosted and what is managed cloud.
If you arrived from a search like hermes dashboard, hermes agent dashboard, hermes web ui, or hermes webui, start with the command, not the marketing copy: run `hermes doctor`, then `hermes dashboard`, then confirm the page opens on localhost. Only after that should you debug channels, cron delivery, or reverse-proxy access.
The fastest way to use the dashboard well is to treat it as a checklist: active profile, config path, provider/model, memory backend, enabled tools, skills, cron jobs, sessions, gateway process, and recent logs. If one of those does not match the runtime you expected, fix that layer before rotating tokens or reinstalling Hermes.
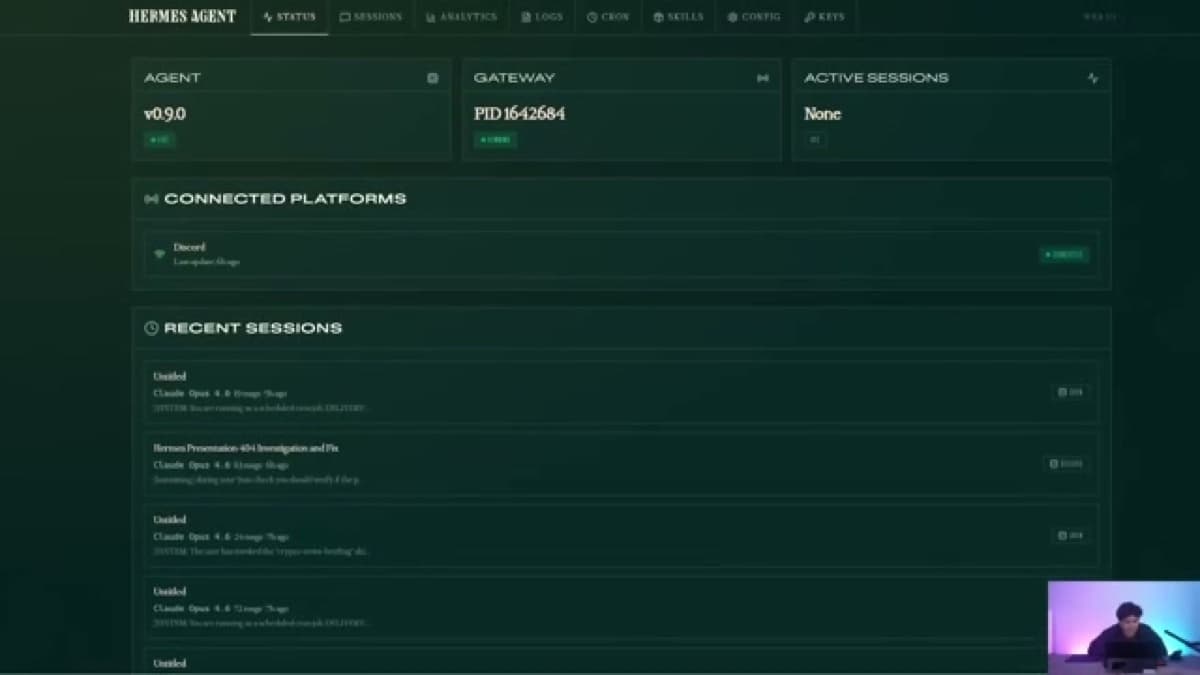
The BoxminingAI walkthrough (video: GfQEdMZ9LlA) captures exactly how the dashboard is used in a real multi-agent fleet. The reviewer runs Hermes on a VPS and has 183 accumulated sessions visible in the Sessions tab. He highlights that you see not just user chat sessions but also system messages from Hermes to itself — useful for tracing exactly when cron jobs were invoked and what their delivery status was.
The Analytics tab lets you filter by 7 days or 90 days, see total API calls and tokens consumed, and get a per-model breakdown when you switch models mid-session. This is how power users identify which providers are consuming the most budget.
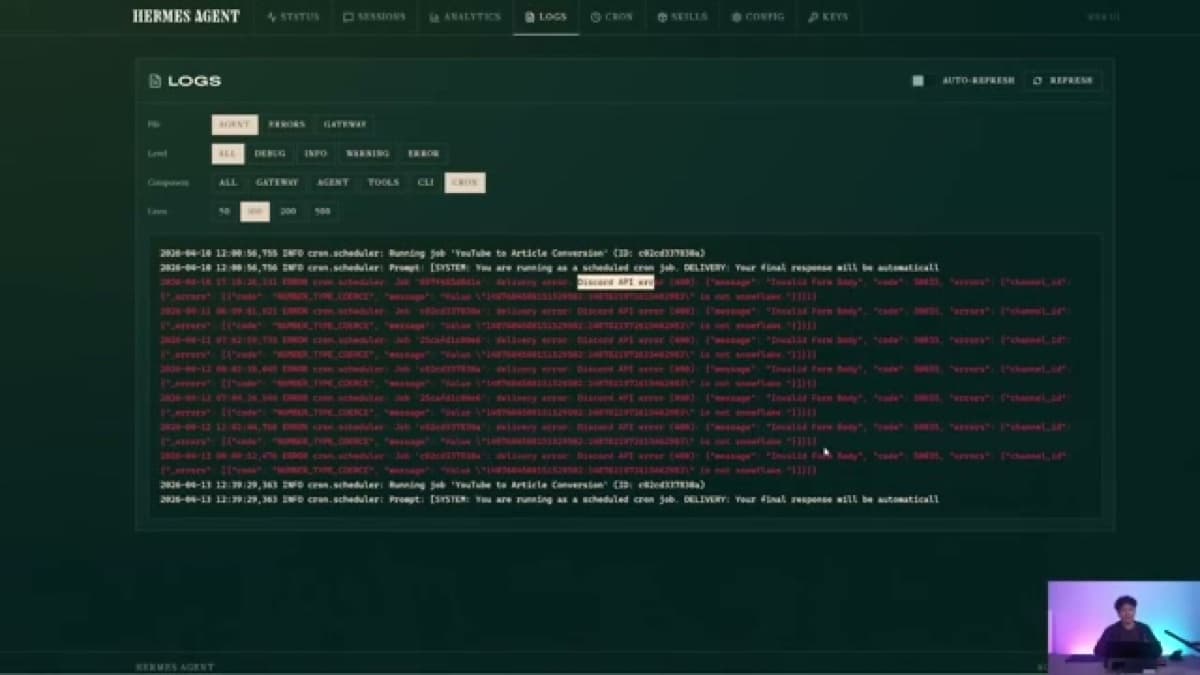
The Logs tab is the primary debugging surface for failed cron jobs. In the video the reviewer shows cron job failures caused by Discord API issues — the log entry shows the exact failure message which you can copy and paste directly to your Hermes agent asking 'Why is this happening and can you fix it?'
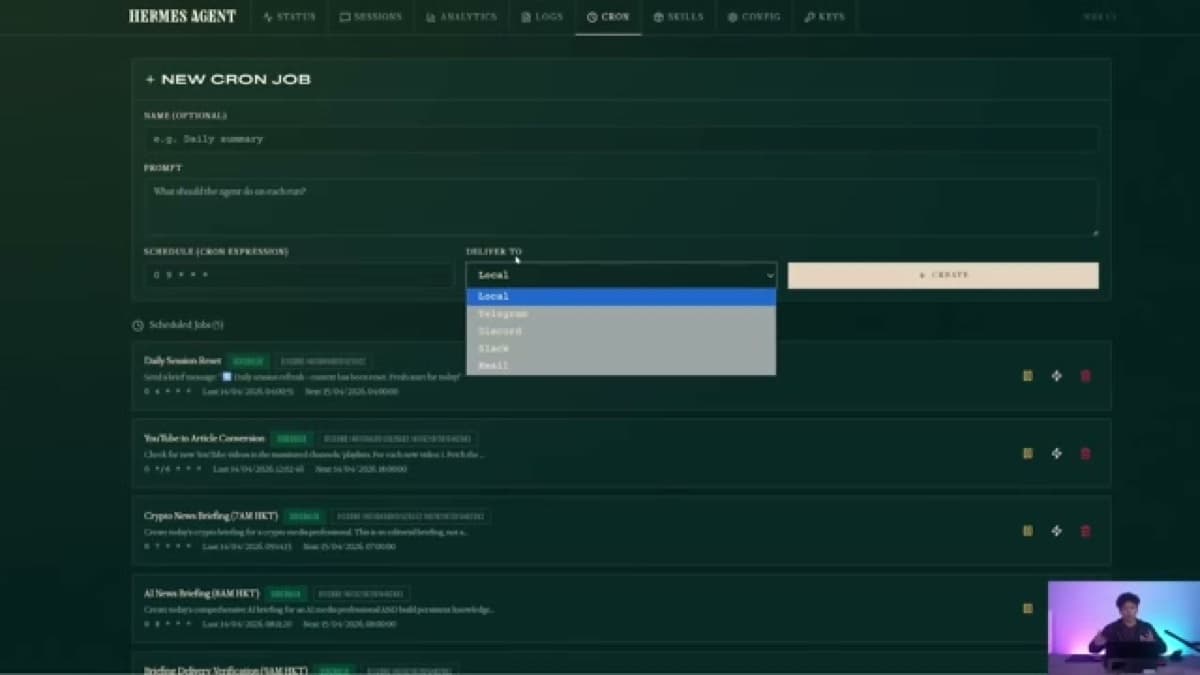
The Cron Jobs tab is where you create and manage scheduled tasks without touching the terminal: give the cron a name, describe what the agent should do each run, set the schedule (e.g., `0 9 * * *` for 9 a.m.), and choose the delivery platform — local, Discord, Telegram, or email.
The Skills tab lists every installed skill, categorized by type: general, autonomous AI agent, coding, data science, DevOps, email, gaming, GitHub, inference, leisure, MCPs, note-taking/Obsidian, and more. The reviewer specifically calls out GitHub skills as 'super underrated' for anyone who needs to commit or push code. The tab also shows all native toolsets (web search, browser automation, terminal processes, text-to-speech, vision/image analysis, clarifying questions).
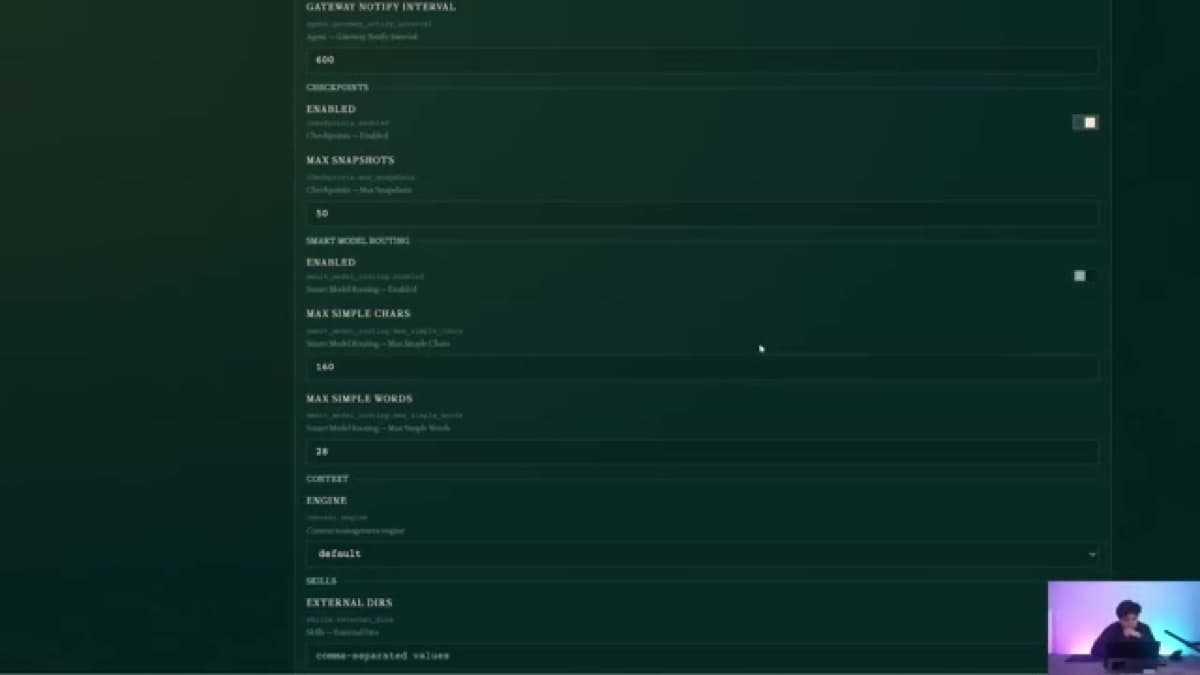
The Config tab is a full GUI over your Hermes config file. Key sections: Fallback Providers (add a backup API key for when your primary hits usage limits), Response Time (increase the gateway timeout, default 1800 seconds, when agents silently time out), Smart Model Routing (enables smarter output routing, disabled by default), Context Engine Management (system-prompt-style context engine config), Display/Personality (set agent personality, default is 'kawaii'), Memory (enable/disable memory and user profile), Auxiliary (configure providers, models, and timeouts for spawned sub-agents). All changes here are equivalent to editing the Hermes config file directly in terminal.
Weekly buyer evidence now points at one commercial dashboard question: people want to manage long-running agents, sessions, logs, cron jobs, Telegram/Discord delivery, and provider usage from one place. The self-hosted dashboard answers the visibility part; FlyHermes answers the uptime and operations part when buyers do not want to maintain the VPS, gateway, and provider stack themselves.
Current Hermes docs describe the dashboard as a machine-level management surface. That matters for teams: the profile switcher decides which profile Config, API Keys, Skills, MCP, Models, and Chat read and write, while gateway processes still need `hermes -p <name> gateway ...` management. In other words, the dashboard can reduce YAML editing, but it does not remove profile discipline.
Use `--isolated` only for the old per-profile behavior or when different profiles genuinely need different auth/network exposure. Most operators should prefer one private machine dashboard with an explicit profile switcher, because it prevents mystery servers and makes the write target visible in the URL and sidebar.
The docs also clarify prerequisites: the basic install does not always include the HTTP stack or PTY helper. Install the web extra for the dashboard, add PTY support for browser Chat, and use the dashboard as an admin surface rather than a public customer-facing chat app.
The dashboard searcher is usually not asking whether Hermes has pixels on a page; they are asking how to trust a long-running agent. The answer is to inspect sessions, analytics, logs, cron jobs, skills, MCP, provider state, and gateway health in Web UI, then prove the real delivery path with one Telegram/Discord message or one completed cron output.
This is also why the page now uses AI agent command center language. The Web UI is the self-hosted control plane for operators who want visibility into local runtime state. It is not a public SaaS app by default, and it should not be exposed just because a teammate wants browser access. If the desired outcome is hosted browser/mobile agent work with managed uptime, that is the FlyHermes path.
Best use cases
How this fits with Hermes Agent
Daily operator check
Open the dashboard before trusting an always-on agent: confirm the active profile, provider, memory, skills, cron queue, gateway state, logs, and browser Chat boundary, then verify the real channel or job output that matters.
What the dashboard does
It helps operators inspect and manage local Hermes state: active profile, config, sessions, memory, skills, tools, cron jobs, model/provider state, logs, gateway health, and browser Chat when enabled.
What the dashboard does not do
It does not magically host Hermes, secure a VPS, keep Telegram/Discord online, pay provider bills, replace `hermes doctor`, or prove channel delivery without an end-to-end message test.
When to stop self-hosting the dashboard
If the team wants browser/mobile access, connected channels, bundled API costs, and uptime without owning Docker, nginx, secrets, and restarts, the dashboard is showing you a FlyHermes use case.
Local Hermes Web UI for solo operators
Run Hermes on your laptop, start hermes dashboard, and use WebUI to confirm configuration, memory, skills, tools, cron jobs, sessions, and channel health.
Gateway recovery checkpoint
When Telegram or Discord stops replying, open WebUI to confirm the active profile, provider state, gateway service, and recent cron/tool configuration before rotating tokens or rebuilding the bot.
Protected dashboard for VPS/self-hosting
Run WebUI on a server only behind a private/protected route. Pair it with Docker/VPS/security guides so the dashboard does not become a public admin panel.
Managed cloud chat with FlyHermes
Use FlyHermes when the actual need is browser chat, phone access, Telegram/Discord setup, and hosted uptime without Docker, nginx, provider keys, and gateway maintenance.
Integration debugging surface
When Telegram, Discord, GitHub, VS Code, or MCP tools behave oddly, WebUI gives a visual checkpoint before dropping into logs and CLI commands.
Search query to action map
Dashboard searchers usually need one concrete next step: open with `hermes dashboard`, change ports with `--port`, avoid browser launch with `--no-open`, and keep the admin surface private.
Reader checkpoint before changing config
Use WebUI to confirm the actual profile, provider, memory, skills, tools, cron jobs, and gateway state before editing `.env`, config.yaml, Docker mounts, or Telegram/Discord credentials.
Dashboard-to-proof workflow
Use Web UI to inspect the runtime layer, then validate the actual user-facing outcome: a Telegram reply, Discord thread response, delivered cron report, browser Chat response, or provider/API call. The dashboard narrows the failure layer; it is not the final proof by itself.
Team/mobile decision workflow
If someone asks for the dashboard because they need teammates, phone access, connected channels, and uptime, decide whether this is really a FlyHermes managed-cloud use case before adding reverse proxies, public ports, or shared self-hosted admin credentials.
Claude Code alternative command center
Use Web UI when a coding-agent workflow grows from one active terminal into multiple sessions, scheduled checks, provider decisions, and Telegram/Discord delivery. Use FlyHermes when that command center needs to be hosted and maintained for you.
Related Hermes Agent guides
How to use the Hermes Web UI safely
Exact dashboard command, port flags, server workflow, and security checklist for WebUI.
FlyHermes managed dashboard and cloud chat
Choose FlyHermes when you want the hosted browser chat workspace, mobile access, connected channels, and managed uptime.
Deploy Hermes Agent on a VPS
Use this with WebUI if you want a 24/7 self-hosted agent and understand the server maintenance cost.
Hermes Docker Compose setup
Run Hermes with Docker, then open the dashboard through a protected local or private route.
Connect Telegram to Hermes
Use the dashboard to verify channel/gateway health after connecting Telegram.
FAQ
Yes, for self-hosted Hermes operators. It is the private command center for sessions, analytics, logs, cron jobs, skills, MCP, config, gateway health, and browser Chat. It is not the same as a hosted team/mobile SaaS workspace; use FlyHermes for managed browser/mobile access and uptime.
It should prove which layer is healthy or broken: selected profile, model/provider, memory, skills, MCP tools, cron schedule, logs, gateway state, or browser Chat. For Telegram, Discord, and cron jobs, the final proof is still a real delivered message or report outside the dashboard.
Check the active profile, provider, memory, skills, tools, cron jobs, logs, sessions, and gateway health first. Then verify the real output path — a Telegram/Discord reply, a cron delivery, a command result, or browser Chat response — because a healthy dashboard alone does not prove every channel works.
It shows and manages local Hermes operational state: configuration, active profile, model/provider status, memory, skills, tools, cron jobs, sessions, and gateway health.
It does not remove the need to run Hermes somewhere, secure the dashboard, maintain provider keys, restart gateways, or verify Telegram/Discord end-to-end. It is an admin dashboard, not a complete managed hosted agent product.
No. The self-hosted Hermes Web UI/dashboard is for local configuration and monitoring. FlyHermes is the hosted cloud experience for browser chat, mobile access, connected channels, managed uptime, and less VPS/Docker/provider maintenance.
Do not expose it raw to the internet. Keep it on localhost, behind an SSH tunnel, VPN, or a hardened reverse proxy with authentication.
Check the active profile, provider/model state, gateway status, tool availability, cron jobs, and recent service health, then confirm with hermes gateway status and a real message in the target chat.
Start the dashboard on localhost, confirm the active profile and provider, check memory/tools/cron/gateway status, then send one real Telegram or Discord message if a gateway is involved. Do not expose the dashboard publicly until access control is designed.
Run `hermes dashboard`. If the default port is busy, run `hermes dashboard --port 9120`. On a VPS or SSH session, run `hermes dashboard --no-open` and reach it only through a trusted private path.
The dashboard can show local state, but gateway delivery also depends on platform permissions, topic/thread routing, allowlists, provider credits, and the live gateway process. Always test the exact chat or channel.
Yes. After Desktop connects to a remote runtime, open the backend Web UI privately and confirm the active profile, provider, model, tools, memory, skills, cron jobs, sessions, and gateway status.
Yes, when the dashboard has the web and PTY dependencies available. The Chat tab runs the real Hermes TUI behind a PTY/WebSocket, so it is a self-hosted browser view into your local/server runtime, not managed cloud chat.
That error means Hermes code is out of date or the gateway process is running old in-memory modules after a Hermes update. The Discord adapter started, but a gateway turn called a method that no longer exists in the installed version. Fix it by updating Hermes, then hard-restarting the gateway process (not just /restart from inside the gateway — kill and restart the actual service/process).
Yes. Hermes Agent includes a self-hosted Dashboard/Web UI for configuration, sessions, memory, skills, tools, cron jobs, logs, and gateway health. It is an operations/admin surface, not a managed hosted workspace by itself.
Only behind strong access control. Keep it on localhost when possible, or use an SSH tunnel, VPN, firewall rules, HTTPS, and authentication. Do not expose a raw dashboard port to the public internet.
Dashboard Chat is a self-hosted browser view into your own Hermes runtime when the Web UI/TUI dependencies are installed. FlyHermes is the managed cloud experience for browser/mobile access, connected channels, and uptime without maintaining the runtime yourself.
By default the dashboard opens on localhost port 9119. Use `hermes dashboard --port 9120` or another free port when 9119 is occupied.
Use `--no-open` on servers, SSH sessions, Docker/VPS deployments, and cron-like environments where opening a local browser is wrong. Pair it with a private tunnel or protected reverse proxy, not a raw public port.
On macOS and launchd-style contexts, Hermes may run with a reduced PATH. Verify Node/npm from the shell, build the frontend once in the Hermes source checkout if needed, or point `HERMES_WEB_DIST` at the existing built assets.
Run `hermes dashboard` after the CLI is installed and `hermes doctor` passes. The dashboard opens on localhost by default.
The default dashboard port is 9119. Use `hermes dashboard --port 9120` or another open port if 9119 is already in use.
Choose self-hosted Web UI when you want to operate your own Hermes runtime. Choose FlyHermes when you want hosted browser/mobile chat, connected channels, bundled API costs, and managed uptime without running a VPS or gateway stack.
On a VPS you cannot click the link directly — it will show 'site can't be reached.' Instead, open your local terminal (or PowerShell on Windows) and create an SSH tunnel: `ssh -L 9119:localhost:9119 your-vps-user@your-vps-ip`. Once the tunnel is active, click the localhost:9119 link and the dashboard will load.
The Sessions tab shows both your chat conversations with Hermes and system messages — notifications from the Hermes agent system itself. System messages include cron job invocations, delivery confirmations, and error notifications. This makes it the go-to view for tracing what the agent did and when, especially for debugging cron job failures.
The Analytics tab shows total API call counts, total tokens consumed, a day-by-day usage graph (filterable by 7 days or 90 days), and a per-model breakdown. The per-model breakdown is especially useful when you switch providers mid-session — it tells you which models are consuming the most budget so you can optimize your fallback configuration.
Yes. In the Cron Jobs tab, give the cron a name, describe what the agent should do on each run, set the schedule using cron syntax (e.g., `0 9 * * *` for 9 a.m. daily), and choose the delivery target: local, Discord, Telegram, or email. The dashboard writes the config for you without requiring any terminal edits.
The Logs tab is the primary place to debug failed scheduled tasks. When a cron job fails — for example due to a Discord API issue — the log shows the exact failure message. You can copy that message and paste it directly into a chat with your Hermes agent asking it to diagnose and fix the problem.
Fallback Providers let you add a backup API key and provider so Hermes automatically switches when your primary provider hits usage limits or goes down. For example, if you are on the Claude plan and run out of tokens, you can configure a fallback like MiniMax or another provider so the agent keeps working.
The default gateway timeout is 1800 seconds. Some users see their agent silently fail to respond or time out without an error, especially on slow providers or long tasks. Increasing this value gives Hermes more time to complete a response before the gateway cuts the connection.
The Auxiliary section configures the provider, model, base URL, API key, and timeout for sub-agents that Hermes spawns. If you want the orchestrating agent and its sub-agents to use different models or providers, this is where you set that up.
Open the active profile, provider/model, fallback providers, usage/analytics, gateway timeout, memory, tools, cron jobs, and recent logs. If a provider hit 402/429 or a fallback is misconfigured, the dashboard can show the control-plane state, but you should still run a small CLI or channel smoke test afterward.
Long-running agents fail in layers: provider credits, model routing, cron schedule, gateway process, allowed chat/thread IDs, logs, and server uptime. The dashboard gives one browser place to inspect those layers before you rotate tokens, rebuild Docker, or expose the service publicly.
Current Hermes docs describe it as a machine-level management surface. One dashboard server can manage multiple profiles through the sidebar profile switcher; Config, API Keys, Skills, MCP, Models, and Chat follow the selected profile.
Use `--isolated` only when you deliberately want a dedicated server scoped to one profile, for example when different profiles need different authentication or network exposure. For normal local work, use the unified machine dashboard and switch profiles inside it.
The Web Dashboard needs the Hermes web extra. The Chat tab also needs PTY support so Hermes can spawn the embedded TUI behind a pseudo-terminal; on native Windows, use WSL2 for PTY-backed Chat.