
Most AI agent failures are not spectacular. A scheduled brief never arrives. A webhook fires twice. A background job exits successfully but produces the wrong artifact. A provider hits a rate limit while the dashboard still says the gateway is connected.
That is why AI agent monitoring needs more than process uptime. You need to see whether the trigger arrived, the agent started, the right tools ran, the expected output was created, and delivery reached the exact person or channel.
Quick answer#
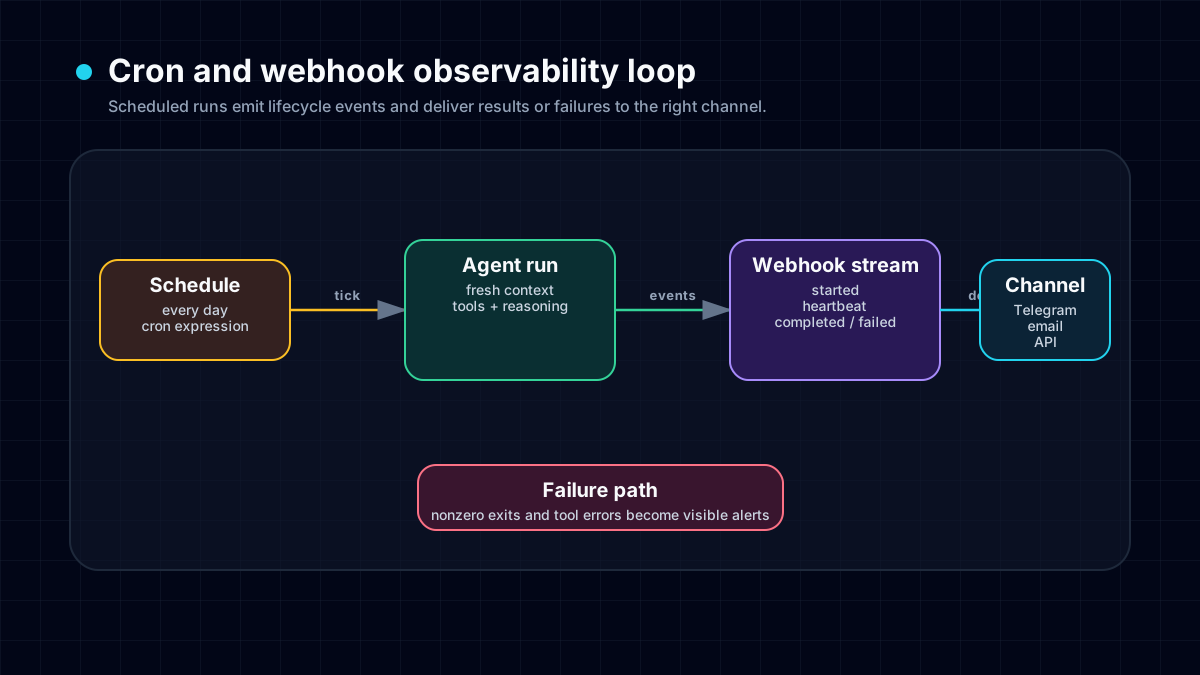
Monitor an AI agent as an outcome pipeline, not as one process. For Hermes Agent, check five layers: trigger, agent run, tool activity, artifact, and delivery. Use the Hermes dashboard for profile, provider, cron, memory, tool, gateway, running/failed session, approval, log, and cost visibility; then verify the real file, URL, pull-request comment, Telegram topic, or Discord thread outside the dashboard. A useful mission-control checklist answers what is running, what failed, what is waiting, what changed, what the agent learned, and what needs action next. Use cron jobs for scheduled checks and webhooks for event-driven work.
If the business requirement is reliable 24/7 operation rather than maintaining an observability stack, compare self-hosted vs hosted AI agents and FlyHermes pricing.
Monitor control changes with their actual activation rules#
Not every dashboard toggle has the same lifecycle. Current official docs describe dynamic webhook disabling as a hot-reloaded change: the next incoming event is rejected with HTTP 403 without a restart. MCP disabling retains configuration but takes effect on the next gateway restart. Channel changes also require distinguishing the saved state from the gateway connection after restart.
- Classify a disabled webhook rejection as an expected policy result, not an uptime incident.
- Record when a restart-dependent change was applied; a saved toggle alone is not evidence that a running worker changed.
- For incident containment, inspect already-running work separately. These documented controls do not establish that every in-flight side effect is cancelled.
Use the dashboard control checklist before adding a retry that could undo an intentional stop.
Do not alert on cron doctor exit code alone#
hermes cron doctor is a read-only fleet check, but a nonzero result can describe historical lateness after a successful catch-up. That lateness finding clears on the next on-time dispatch, not immediately when the catch-up finishes. A monitor should include the finding text and latest attempt outcome instead of repeatedly asserting that execution is still broken.
Pair doctor with hermes cron runs --limit 20 and hermes cron incidents. Repeated identical incidents can suppress notifications during a cooldown while failures continue in the ledger. Conversely, delivery failures do not increment the execution failure streak. The cron diagnostics guide shows how to keep late dispatch, failed work, and missing delivery separate in an alert.
Source: official Hermes scheduled-task documentation.
What AI agent monitoring must answer#
Traditional service monitoring asks whether a process is up, how long a request took, and whether an endpoint returned an error. Agent monitoring has to answer harder questions:
- Did the event or schedule actually trigger?
- Did the intended profile and model run?
- Which tools, files, websites, and external systems did the agent touch?
- Did the work create the expected artifact or state change?
- Did the result reach the correct channel or user?
- Was the result useful, safe, and within cost limits?
Fresh 2026 search results consistently define agent observability around traces, logs, costs, errors, evaluations, tool calls, and memory reads. Recent Reddit discussions add the production pain behind that definition: autonomous decisions accumulate context, so request-response logs alone do not explain why an agent acted or whether the final outcome was correct.
For Hermes operators, the practical lesson is simpler: connected is not completed. A green gateway, HTTP 200, or zero exit code is a checkpoint. The delivered outcome is the proof.
For a managed API, distinguish a budget pause from a worker failure. The Claude Managed Agents review describes a session that becomes idle at its spending threshold while preserving state. A useful monitor should expose the stop reason and approval path, not automatically resume every idle session and defeat the intended spending control.
For hosted execution, monitor cleanup independently from completion. The OpenAI Agents API review distinguishes closing an event stream, cancelling a turn and deleting a session. A successful answer should not clear an alert about an unhandled cleanup failure; retain the session identifier and make deletion retries bounded.
The five-layer Hermes monitoring model#
1. Trigger monitoring#
A run can begin from a cron schedule, an incoming webhook, a Telegram or Discord message, a CLI command, or a manually started background process. Record enough information to prove the trigger existed:
- source and event type;
- schedule or event timestamp;
- route/job name;
- stable event or delivery ID;
- active Hermes profile;
- target project or
workdir.
For scheduled work, hermes cron list and hermes cron status show job state, but the schedule-tasks guide explains the stronger pattern: pin the profile, provider, model, project directory, and delivery destination, then run the job once immediately.
For event-driven work, Hermes exposes a webhook server with named routes. The default health check is:
curl http://localhost:8644/health
A healthy response proves the adapter is listening. It does not prove your GitHub, Stripe, JIRA, GitLab, or custom service can reach the route or pass signature validation.
2. Run monitoring#
Once triggered, identify the actual agent run rather than assuming the intended one started. Check:
- start and finish timestamps;
- status: queued, running, completed, failed, timed out, or cancelled;
- model and provider selected;
- token/credit or rate-limit failures;
- session/profile ID;
- retry count and whether the retry is safe.
Provider health belongs in this layer. A gateway can be connected while the model fails with 402, 429, an expired OAuth token, or an unavailable fallback. Use the provider costs and rate limits guide and provider fallbacks guide before treating every missed reply as a webhook or gateway failure.
3. Tool and action monitoring#
An agent can return a polished final answer after a tool failed, a file was edited in the wrong repo, or a browser action never reached production. Monitor the actions that matter:
- tool name and outcome;
- file/repository path;
- external URL or API route;
- approval decisions;
- command exit code;
- side-effect identifiers such as commit SHA, deployment ID, PR number, or webhook delivery ID.
Do not log raw secrets, bot tokens, authentication headers, or full sensitive payloads. Store references and redacted metadata instead. If an unattended workflow uses MCP tools, follow the MCP security risks guide: individually safe tools can become risky when the agent can bridge private data into a write action.
4. Artifact monitoring#
This is the layer most generic observability pages miss. Define the proof object before the run starts:
- a file exists and can be read back;
- a report contains the required sections;
- a commit was pushed;
- a build and relevant tests passed;
- a canonical page is live and rendered correctly;
- a database row or ticket exists once, not twice;
- a quiet monitor emitted nothing because no threshold was crossed.
For publishing, curl 200 is not enough. The success contract can require a live canonical URL, sitemap inclusion, desktop and phone rendering, no horizontal overflow, and visible heading/list/code/link styling. For backups, verify restoreability rather than only archive creation. For alerts, verify deduplication and the exact destination.
5. Delivery monitoring#
A completed result that never reaches its destination is an operational failure. Check the exact delivery path:
- Telegram chat and
message_thread_id; - Discord channel and thread;
- Slack channel;
- GitHub repository and PR/issue number;
- email recipient;
- log or file destination.
Use the gateway troubleshooting checklist when the agent works locally but channel delivery fails. A parent-group test does not prove a Telegram forum topic works, and a Discord guild connection does not prove the bot can read and reply in one protected thread.
Webhooks: event-driven agent monitoring#
Hermes webhooks receive external POST events, validate signatures, transform payloads into prompts, and route the result to a channel or source system. Enable the adapter with:
hermes gateway setup
Or configure the environment for the active profile:
WEBHOOK_ENABLED=true
WEBHOOK_PORT=8644
WEBHOOK_SECRET=replace-with-a-real-secret
Create and inspect dynamic routes with:
hermes webhook subscribe alerts
hermes webhook list
hermes webhook test alerts
A production webhook route should define:
- accepted
events; - a per-route HMAC
secret; - payload
filtersso irrelevant events do not wake the agent; - a narrow prompt template;
- only the required skills;
- an explicit delivery destination;
- an idempotency strategy for provider retries.
Use deliver_only: true when the event only needs templated delivery and no reasoning. That skips the agent, reduces latency, and avoids model cost. Use an LLM-driven route only when the payload needs classification, investigation, summarization, or a tool-using response.
Interpret webhook receipts before declaring success#
An HTTP receipt is not a completed agent outcome. Read the JSON body and execution mode together:
- Direct delivery:
200withstatus=deliveredmeans the target adapter accepted delivery.200can also reportignoredorduplicate, so a status-only monitor overcounts successful notifications. - Script filtering: a missing script, timeout, or nonzero exit can produce
status=ignoredwithreason=script. Separate intentional silence from a broken transform. - Existing-job trigger:
202accepts background work; inspect the job's later artifact and delivery. The job owns its delivery settings, not the webhook route. - Coalescing:
202withstatus=coalescedbuffers distinct events for one entity. The latest payload wins; it is not a durable transaction queue. A normal disconnect flushes pending groups, while a hard kill can lose the buffered window. - Direct-delivery failure:
502means the target adapter rejected delivery or raised. Reconcile the destination before a bounded retry rather than assuming nothing happened.
The documented delivery-ID cache lasts one hour. Keep a durable application-level key for consequential writes; same-ID retry suppression does not establish exactly-once execution. The webhook setup and retry guide includes a harmless acceptance matrix, explicit chat/topic targeting, and the difference between delivery and session mirroring.
Source: official webhook response codes and mode rules, checked October 18, 2026. This is documentation-based guidance, not a delivery benchmark.
A safe webhook route example#
This example sends a Telegram alert only for a push to main:
platforms:
  webhook:
    enabled: true
    extra:
      port: 8644
      secret: "global-fallback-secret"
      routes:
        deploy-notify:
          events: ["push"]
          secret: "route-specific-secret"
          prompt: "New push to {repository.full_name}: {head_commit.message}"
          filters:
            - field: "ref"
              equals: "refs/heads/main"
          deliver: "telegram"
          deliver_extra:
            chat_id: "-1001234567890"
            message_thread_id: "42"
          deliver_only: true
Replace the example chat and topic IDs with your non-production destination. Without an explicit chat ID, delivery falls back to the platform home channel. Keep secrets in ~/.hermes/.env or protected config, never in a public repository. Use INSECURE_NO_AUTH only for a local test. Authentication proves who sent the event; it does not make payload text safe. Treat every payload field as untrusted data and avoid templates that turn arbitrary payload text into unrestricted tool instructions.
Cron vs webhook vs background process#
Choose the trigger that matches the work:
- Cron: use when time is the trigger—morning briefs, weekly audits, backups, scheduled publishing, or periodic health checks.
- Webhook: use when an external event is the trigger—a pull request, payment, issue, deployment, form submission, or incident alert.
- Background process: use for a long-lived stream, server, worker, or bounded build that does not map cleanly to a schedule or external callback.
Do not poll every minute when the upstream service can send a signed webhook. Do not keep an LLM agent awake when a deterministic script can stay silent. For local deterministic monitoring, use script-only cron with no_agent=true; for rare process milestones, use process completion or a narrowly matched signal rather than constant chat updates.
A managed session runtime has a different monitoring boundary from an always-on gateway. The Foundry Agent Service review distinguishes response completion, the session idle timer and later compute deprovisioning. When comparing hosting approaches, inspect those lifecycle events separately; a successful answer does not show that compute has stopped or that long-running work can recover safely.
A copy-paste monitoring contract#
Add a contract like this to any production agent job:
Success means:
- the intended trigger was received once;
- the run used the pinned profile, provider, and workdir;
- all required tool actions completed without hidden failures;
- the expected artifact exists and passes its validation checks;
- delivery reached the exact configured destination;
- the final report includes identifiers and evidence, not only “done.”

On failure, report the failing layer: trigger, run, tool, artifact, or delivery.
Do not expose secrets. Do not retry non-idempotent writes automatically.
This creates a useful failure report instead of a vague “agent failed” message.
Alerts that are worth sending#
Alert on conditions that require action:
- scheduled run missed or exceeded its normal duration;
- repeated provider/authentication failure;
- tool permission or approval denied;
- artifact missing or validation failed;
- delivery failed twice;
- unexpected cost or token spike;
- duplicate side effect detected;
- webhook signature or replay check failed;
- gateway repeatedly restarts or drains without recovery.
Avoid sending “everything is healthy” every minute. Quiet success is a feature. Stateful monitors should remember the last condition and alert only on a meaningful transition or repeated threshold breach.
Common monitoring failures#
The dashboard is green, but nothing arrived#
The dashboard proves local state is plausible. Test the exact channel or webhook route. Check profile, provider, allowlists, topic/thread IDs, platform permissions, and recent gateway logs.
The webhook returns 200, but no agent runs#
An event or payload filter may have intentionally ignored it. Check event headers, route name, filter paths, script output, and whether the route is in deliver_only mode.
The same event creates duplicate work#
Webhook providers retry. Preserve a stable event ID and make writes idempotent. Do not automatically repeat purchases, messages, ticket creation, or destructive actions because a previous response timed out.
The job says completed, but the output is wrong#
Add artifact-level checks. Validate required sections, file contents, row counts, commit/diff scope, live rendering, or business rules before delivery.
Monitoring itself costs too much#
Move deterministic checks to script-only cron or deliver_only webhooks. Reserve the LLM for interpretation and recovery decisions. Pin the provider/model so a global model switch cannot silently increase unattended spend.
Self-hosted monitoring vs FlyHermes#
Self-hosting gives you control over webhook ingress, gateway processes, model providers, logs, scripts, networks, and data retention. It also means you own TLS, firewalling, signatures, process supervision, backups, provider credits, alert delivery, upgrades, and incident recovery.
Use self-hosted Hermes when those controls are the reason you chose it. Use FlyHermes when the outcome is “my agent stays available from browser and phone, with connected channels” and infrastructure ownership is not the product you want to build.
The decision is not open source versus managed in the abstract. It is whether your team wants to operate the trigger-to-delivery chain.
AI agent monitoring checklist#
Before trusting an unattended workflow, verify:
- The trigger has a stable name and ID.
- The active profile, provider, model, and
workdirare pinned. - Secrets are redacted and stored outside prompts/public repos.
- Tool side effects have identifiers and approval boundaries.
- Webhook writes are idempotent.
- The expected artifact has a machine-checkable validation step.
- The exact Telegram/Discord/GitHub/email destination was tested.
- Quiet success does not create notification spam.
- Provider cost and rate-limit alerts exist.
- A human knows how to pause the job or gateway.
FAQ#
What is AI agent monitoring?#
AI agent monitoring tracks the full path from trigger through model reasoning, tool calls, memory/context, artifact creation, and delivery. Process uptime and latency are useful, but they do not prove the agent completed the intended business outcome.
Can Hermes Agent receive webhooks?#
Yes. Enable the webhook adapter, create named routes in config or with hermes webhook subscribe, point the external service to /webhooks/<route-name>, and use HMAC secrets, filters, idempotency, and explicit delivery targets.
Should every webhook wake the LLM?#
No. Use filters and deliver_only: true for deterministic notifications. Wake an agent only when the event needs judgment, investigation, summarization, or tool use.
How do I monitor Hermes cron jobs?#
Check job state with the CLI or dashboard, but define success as the actual delivered report, file, commit, alert, or live URL. Pin provider/model, profile, workdir, and delivery so unattended runs cannot drift silently.
How do I avoid duplicate webhook actions?#
Use provider event IDs as idempotency keys, persist processed IDs, and make writes safe to retry. Never assume an HTTP retry means the original action did not happen.
Do I need FlyHermes for monitoring?#
No. Hermes Agent can be fully self-hosted. FlyHermes is the managed option when you want browser/mobile access, connected channels, and hosted uptime without operating webhook ingress, gateways, providers, and server maintenance yourself.
Use the dashboard as the monitoring checkpoint#
The Hermes Agent dashboard is the fastest place to inspect sessions, logs, cron state, provider usage, MCP/tools, and gateway health. Treat it as the control-plane checkpoint, then verify the monitor’s real output. A webhook, Telegram alert, Discord post, email, or generated artifact is the proof; a green card in Web UI is not.
Monitor duplicate gateway processes, not only downtime#
Gateway monitoring should alert on duplicate responders as well as missing responders. Record the intended service/profile/PID, run a periodic deep-status check, and flag multiple processes using the same platform token. A bot that answers twice is unhealthy even when uptime is 100%. Use the gateway troubleshooting runbook for the duplicate-process recovery path and verify one—not two—replies in the real destination.
Monitor authenticated browser identity, not only page uptime#
A scheduled browser check can return HTTP 200 while silently landing on a sign-in page or the wrong Chromium profile. Record the expected identity boundary, final URL, visible account-state marker, screenshot, and delivery result. For local login state, use the real-profile browser troubleshooting guide and pin the intended profile before scheduling the check.
Monitor Telegram delivery, not just connectivity#
A connected adapter does not prove a message reached the intended topic. Verify the exact chat and thread, watch delivery-ledger recovery after restarts, and keep external side effects idempotent. The Telegram setup guide separates polling, webhooks, status hints, and delivery proof.
Make monitor recovery idempotent#
A monitor that reports unknown after restart must not blindly repeat a consequential action. Reconcile the target, distinguish execution failure from last_delivery_error, and only then trigger a new attempt. The AI agent cron recovery guide maps lifecycle states, [SILENT], failure streaks, timeouts, and controlled reruns.
Fail browser monitors before the global tool timeout#
A scheduled browser check should emit progress checkpoints and fail early when no page navigation occurs. Distinguish a visible CAPTCHA from a stale harness connected to a dead CDP port, then include driver, session name, final URL, screenshot, console result, and delivery state. Copy the recovery acceptance test from the Hermes browser automation guide.
Monitor the dashboard by layers#
Do not collapse dashboard health into one HTTP check. The Hermes Dashboard runbook separates process, port, static assets, selected profile, authentication, and PTY/WebSocket Chat. Monitor the layer your workflow actually depends on, and keep channel delivery as a separate end-to-end check.
A useful monitoring job can start with notifications a service already sends. The Hermes apartment-alert story and how-to follows a creator who replaced brittle rental scraping with saved-search email ingestion, then adds a draft-first setup and failure checks.